How to collect the dump file on Azure via Azure portal?
Go to App Service Menu, once you have accessed your application, search for “Diagnose and Solve Problems”.

Click on “Diagnostics Tools”.
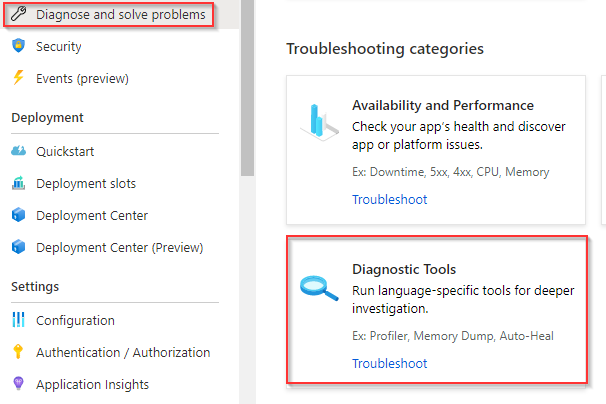
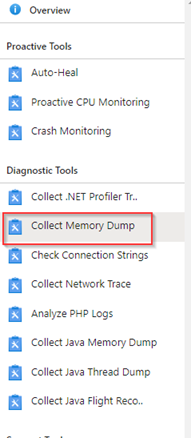
On the Diagnostics Tools on the left side, we will be able to see some tools to collect data on the app services, please select “Collect Memory dump”.
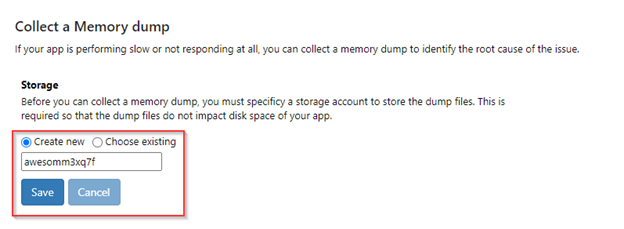
To collect memory dump, you must specify a storage account to store the dump files. You can create a new one or select an existing one.
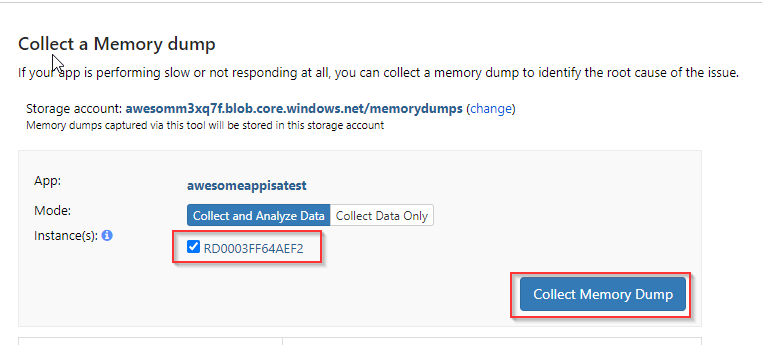
Select the instances and then click on collect memory dump. Will be start to collect the data it’s important that the issue is occurring at that moment so we will be able to collect accurate data.
After the analysis is completed, you will notice two files once that is .dmp and the .mht file. You can also see the last 5 sessions captured.

The dump file will be the full file and you can analyze it using tools like windbg or DebugDiag.
The .mht contain that analysis of the .diagsession file.